The latest analysis charting how the private healthcare market has faired in a year dominated by Covid-19 shows that in October private elective care had returned to pre-pandemic volumes.
This suggests that the private insured and self-pay market had largely recovered before the second national lockdown in England. However, while admissions were largely back to pre-Covid numbers, and the market share by consultant specialty is broadly similar, it’s still too early to say whether things are back to ‘normal’, or what ‘normal’ will even look like following this year of significant market disruption. The second lockdown will inevitably also have an impact, but overall the signs are promising for the sector.
Estimated count of private episodes [1]
![2018, 2019 and 2020 (estimated) count of private admissions [1]](https://phproduksportalstorage.blob.core.windows.net/images/Media/covid-dev-trend.png)
Although activity in October was estimated to be 7% lower than the same month in 2019, the estimated 64,000 elective admissions in October was higher than in February – before the pandemic took grip.
With admissions at a similar level to pre-covid, the type of activity was also trending in a similar pattern to the months before the pandemic.
Private activity by specialty as % admissions
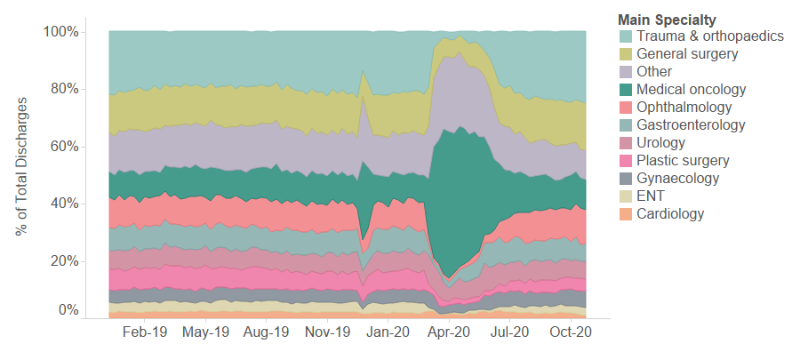
This followed significant disruption to the market which saw medical oncology grow to an estimated 47% of all elective private admissions during the height of the first lockdown in April.
For the first time, some specialties were seeing higher volumes that before the pandemic. Gynaecology had 3,600 admissions compared with 2,900 in January, while it’s market share was up 2% from the beginning of the year to a high of 6%. Ophthalmology was also up 2% in market share at 11%, and admissions at a year high of more than 7,000.
Elsewhere, some specialties have not recovered at the same rate, with plastic surgery and ENT down on the beginning of the year both in market share and admissions.
Our interactive report below shows estimated volumes and market share for each of the ten most common specialties in private healthcare for 2020.
Interactive graph: Estimated admission and market share, 2020
Footnotes
1. Admissions are counted as the number of hospital stays that have been completed within our reporting period. Year on year change are calculated using only sites with confirmed volumes from 2018, 2019 and 2020 for each month. While more hospital sites are submitting data, only those where a three year comparison is possible have been included for year on year change. Estimates for 2020 activity assume these sites are representative of the entire market, with confidence varying depending on number of submitting sites.
To receive a breakdown of the estimated admissions (counted at discharge date) and market share for Jan – Oct 2020, please contact press@phin.org.uk