Covid-19 impact on private healthcare.
Covid-19 has had a dramatic impact on all areas of life. With independent hospitals diverting their resources to support the NHS since the end of March, and with lockdown taking hold, the same is true of private healthcare in the UK. While data on private healthcare during this period is incomplete, with hospitals rightly focusing on supporting the NHS through Covid-19, from the data available we can start to see the impact Covid-19 on the sector.
Private treatment slows to a trickle
Estimated count of private episodes
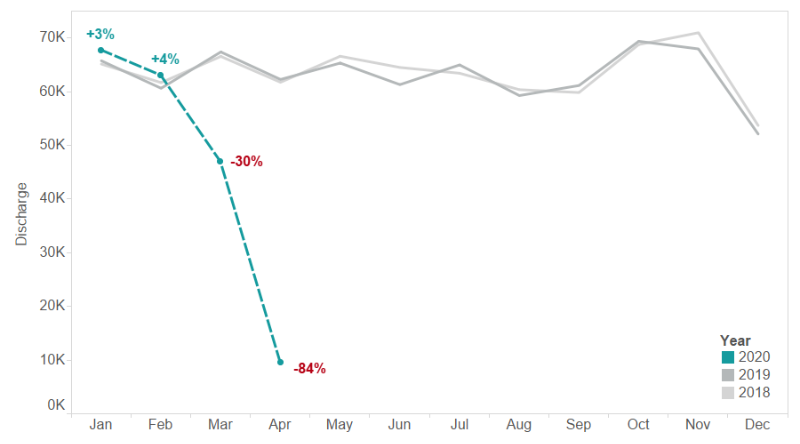
The chart above outlines total episodes of private patient care (discharges) for 2018 and 2019, alongside estimated 2020 episodes.[1] The first two months of 2020 saw an estimated rise of 3% and 4% respectively. In March we estimate a fall of -30% year on year, and in April this had fallen to -84% with the country in lockdown.
Remaining treatment varies by specialty
When looking at episodes by consultant specialty, we can see the make-up of private healthcare has changed dramatically during the pandemic.
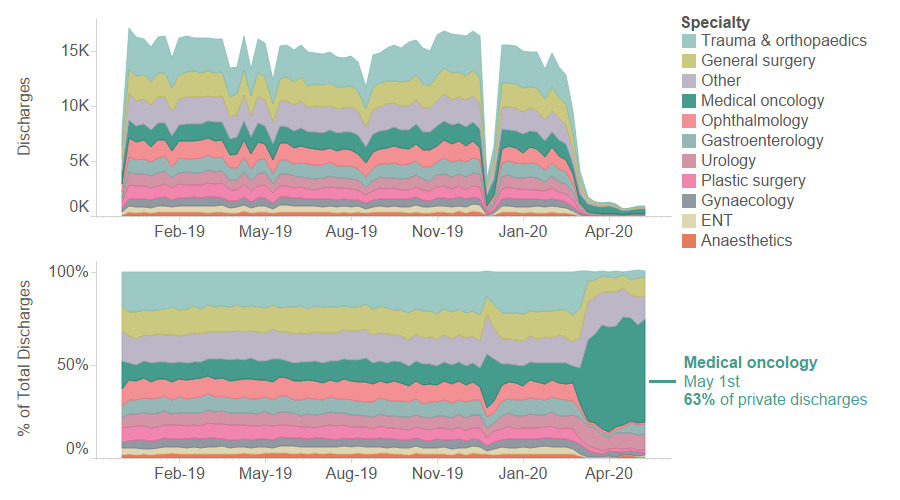
Private activity by specialty as % admissions

The top graph shows all private activity (discharges) split by specialty. Here we can see big falls in activity in December (around Christmas) and from March. While activity is down across the board since March with the global pandemic, there is a continuing baseline of urgent activity, with medical oncology (cancer care) growing in market share from 11% in 2019 to 52% April 2020, and continuing to increase to 63% in May. [2]
Summary
This data does not take account of Covid-19 care or NHS patients treated in independent hospitals NHS Private Patient Units during the pandemic, and is far from complete. Therefore it can’t give a full picture of what is happening across healthcare. However, we can see an emerging picture of the impact Covid-19 has had both on the overall private activity and the specialties which have continued to operate, albeit at a much lower level.
Looking ahead it may be interesting to see what the data shows as we begin to come out of lockdown and how the private healthcare market reacts.
Footnotes
[1] YoY change are calculated using sites with confirmed volumes for 2020 and 2019 for each month, removing influence of delay in private data submissions due to Coronavirus. 2020 volumes are estimated based on sites with confirmed activity. Estimates assume these sites are representative of the entire market, with confidence varying depending on number of submitting sites.
Typical sites submitting per month: 400
- January 2020: 236 Sites
- Feb 2020: 228 Sites
- March 2020: 167 Sites
- April 2020: 75 Sites
[2] Recent share is based upon only sites that have submitted data more recently, however the make-up of these providers is generally representative of the entire market. Whilst medical oncology represents a greater proportion of activity than seen historically, this may be influenced by larger variations caused by smaller number of discharges.
All data, statistics and graphs ©PHIN 2020, all rights reserved. The accuracy of information presented is dependent on the completeness and quality of data supplied by private hospital operators, and may be corrected or updated in future. PHIN accepts no liability for the accuracy of the information. Not to be reused in whole or in part without permission and attribution to PHIN.